Exploring two fundamental approaches to analysing survival data: non-parametric Kaplan-Meier estimation and semi-parametric Cox proportional hazards models.
This is part three of a series on statistical methods for infectious disease epidemiology, with a focus on time-to-event, or “survival”, data.
Statistical inference
Statistical inference is the process of using data to infer the properties of an underlying probability distribution. In the context of survival analysis, we want to estimate the distribution of time-to-event data, which is often incomplete due to censoring or truncation. This is a key challenge in survival analysis, as we need to account for the possibility that we do not observe the event of interest for all individuals in our study. For more details about censored and truncated data see the previous post in this series.
Likelihood estimation
The likelihood function, often termed \(L\), is used to connect statistical models to observed data in both the frequentist and Bayesian frameworks. The likelihood is the probability of observing the data, \(D\), given the parameters, \(\theta\), of the model and formally expressed as:
where \(f\) is the probability density function, and \(X_i\) are assumed to be i.i.d observations in the data.
Frequentist vs Bayesian
In the ‘frequentist’ framework the parameters of a statistical model are considered to have a fixed ‘true’ unknown value to be estimated, and the data are realisations of random variables. The parameters of the model are estimated by maximising the likelihood to obtain the maximum likelihood estimate (MLE), denoted \(\hat{\theta}\).
Bayesian methods are an alternative to maximum likelihood estimation, used to estimate the probability distribution of the parameters of the model given the data, known as the ‘posterior distribution’. In the Bayesian framework, all quantities (both observable quantities and parameters) are considered as random variables, with observed data being realisations of these random variables. The posterior distribution, \(f(\theta \mid D)\), is related to the likelihood function, \(f(D \mid \theta)\), via Bayes formula:
Constructing likelihoods for censored or truncated data requires careful consideration of the information provided by each observation. The previous post in this series provided a definition of censoring and truncation, and the right and left censoring and truncation times.
The likelihood components provided by censored observations, assuming that censoring is independent of the event process, are:
for exactly observed data: information on the probability of the event occurring at this time, i.e. \(f(X)\)
for right-censored observations: information on the survivor function up to a certain time, i.e. \(S(C_r)\)
for left-censored observations: information on the cumulative incidence up to a certain time, i.e. \(F(C_l)\)
for interval-censored observations: information on the probability that the event is within this interval, i.e. \(S(L) - S(R)\).
As data may be observed with different levels of censoring or truncation, the likelihood function is constructed from the joint product of each component for each observation \(i\):
The equivalent likelihood components for truncated data provide information on conditional probabilities of events, given that the individual was observed:
for left-truncated observations, where observation is conditional on the event time being at least the left-truncation time \(Y_l\): \(f(X)/S(Y_l)\)
for right-truncated observations, where observation is conditional on the event of interest having occurred by the truncation time \(Y_r\): \(f(X)/F(Y_r)\)
for interval-truncated observations, where observation is conditional on the event occurring within the truncation interval \([Y_l, Y_r]\): \(f(X)/\{F(Y_r) - F(Y_l)\}\).
Parametric and non-parametric models
The statistical models used for estimating model parameters may be parametric or non-parametric. In general, parametric models rely on assumptions about the distribution of the underlying survival times (e.g. Weibull, Gamma, etc.), so careful selection of this distribution is needed for valid inference.
In contrast, non-parametric models require fewer assumptions about the survival distribution, so can be applied when the functional form of the distribution is not known, but may require more data and not allow for extrapolation beyond the time period of the observed data. Comparisons to non-parametric estimates can be made to assess the fit of a parametric model.
The Kaplan-Meier estimator
The Kaplan-Meier estimator is a widely-used, non-parametric method to estimate the survivor function, \(S(t)\), from censored data, and defined as:
where \(d(t_k)\) is the number of events, and \(n(t_k)\) is the number of individuals at risk just before time \(t_k\), for the observed event times \(t_k \leq t\).
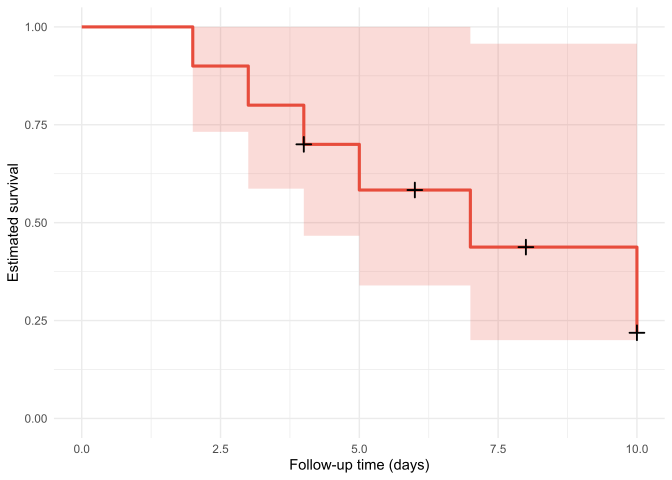
The Kaplan-Meier estimator is a step function, with jumps at each observed event time. At each event time the estimate is multiplied by the proportion of individuals at risk who do not experience the event, so the size of each jump depends on both the number of events and the number still at risk. The Kaplan-Meier estimator is often plotted as a survival curve, with time on the x-axis and the estimated survival probability on the y-axis, as shown in Figure 1 below.
R example
For a short example of the product-limit construction we can use the survival package in R to compute a Kaplan-Meier estimate from a small dataset of 10 observations, with some censored and some observed event times:
Figure 1: Kaplan-Meier survival curve for the example data. Crosses mark censored observations and shaded area shows pointwise 95% confidence limits.
The figure shows the Kaplan-Meier survival curve, with steps at each observed event time and crosses indicating censored observations (including those which coincide with an event time, at days 4 and 10). Survival only steps down at observed event times (rows where n_event > 0), while censored observations reduce the risk set without causing a jump. With only 10 observations the confidence limits are wide.
The Cox proportional hazards model
The Cox proportional hazards model assumes that the hazards of death for any two individuals are proportional over time, expressed by writing the hazard function conditional on a given set of \(M\) constant covariates \(\boldsymbol{z} = \{z_{1}\ldots, z_{M}\}\) as:
where \(h^{(0)}(t)\) is the baseline hazard function, and \(\beta_{m}\) are the regression coefficients. Notably, the ‘hazard ratio’ for the \(m\)th covariate is a constant:
The regression coefficients \(\beta_{m}\) are estimated by maximising the partial likelihood \(L(\boldsymbol{\beta})\) (shown here assuming there are no tied failure times):
where \(\mathcal{E} = \{T_1, T_2, \ldots, T_n\}\) are the set of distinct failure times, \(R_i\) is the set of all individuals who are at risk of failure immediately before time \(T_i\), \(\boldsymbol{z}_{d_i}\) is the covariate vector for an individual who failed at time \(T_i\), and \(\boldsymbol{z}_j\) is the covariate vector for the \(j\)th individual at risk at time \(T_i\). The model can be extended to time-varying covariates \(\boldsymbol{z}(t)\), in which case the hazard ratio is no longer constant over time.
In practice, the proportional hazards assumption should be assessed before interpreting hazard ratios, for example using Schoenfeld residuals or by allowing covariate effects to vary over time.
R example
To illustrate fitting a Cox proportional hazards model, we can use the survival package in R to fit a model to the lung dataset, which contains survival data for patients with advanced lung cancer. We’ll model the hazard of death as a function of age and sex, and check the proportional hazards assumption using Schoenfeld residuals.
library(survival)# lung: time to death (days) for advanced lung cancer patients# status: 1 = censored, 2 = dead; sex: 1 = male, 2 = femalecox_fit <-coxph(Surv(time, status ==2) ~ age + sex, data = lung)round(summary(cox_fit)$coefficients[, c("coef", "exp(coef)", "Pr(>|z|)")], 3)
      coef exp(coef) Pr(>|z|)
age  0.017     1.017    0.065
sex -0.513     0.599    0.002
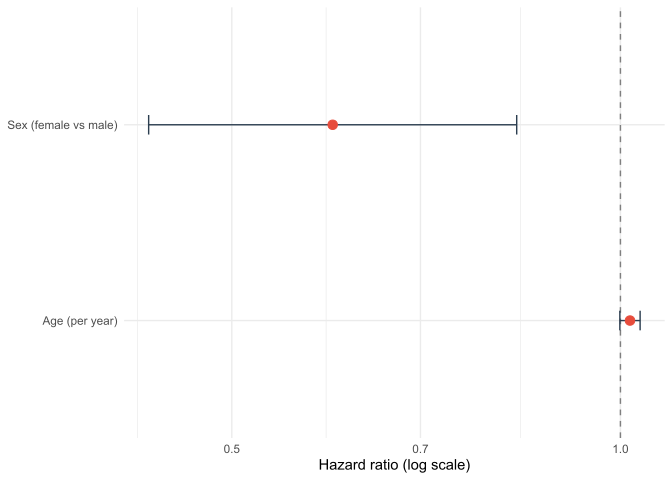
Older age increases the hazard of death (exp(coef) > 1), although there is only weak evidence of an effect (p = 0.06). Female sex is protective (exp(coef) < 1), and there is strong evidence of this effect (p = 0.002). The Schoenfeld test p-values give a quick check of the proportional hazards assumption: here, there is no strong evidence against it (all p > 0.05), but a non-significant test does not prove that the assumption holds, so the residuals should also be inspected graphically with plot(cox.zph(cox_fit)).
NoteKey takeaways
Statistical inference allows us to estimate survival distributions despite incomplete data from censoring or truncation.
Likelihood functions connect our statistical models to observed data, with special adaptations for censored and truncated observations.
Parametric models assume a specific distribution for survival times, while non-parametric approaches make fewer assumptions.
The Kaplan-Meier estimator is a non-parametric method to estimate the survivor function from censored data.
The Cox proportional hazards model relates survival times to explanatory variables through a semi-parametric approach.
The proportional hazards assumption means that the ratio of hazards between different groups remains constant over time.
Coming next
In the next post, I’ll explain how to handle scenarios where multiple possible events can occur, and the challenges this presents for traditional survival methods. I’ll introduce two methods for competing risks data, analogous to the Kaplan-Meier and Cox models described above:
The Aalen-Johansen estimator - a non-parametric method for estimating the cumulative incidence function.
The Fine-Gray model - a regression model for estimating the effect of covariates on the subdistribution hazard.