
This is part four of a series on statistical methods for infectious disease epidemiology, with a focus on time-to-event, or “survival”, data.
Competing risks
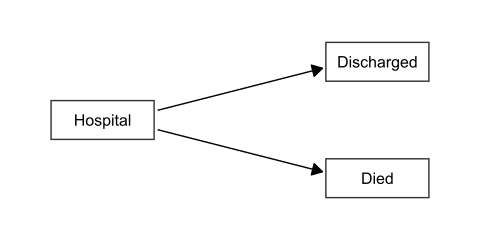
In medical cohort studies, multiple study end-points are common (e.g. death and discharge from hospital). These multiple end-points are known as competing risks and may prevent observation of the event of interest or alter its probability. Treating competing events as ordinary censoring can be problematic when the aim is to estimate the probability of a specific event over time. In particular, the Kaplan-Meier estimator will typically overestimate this probability. Cause-specific Cox models remain useful for modelling cause-specific hazards, but they do not directly estimate the cumulative incidence function in the presence of competing risks.
Note that not every event is a competing risk. An intermediate event, such as admission to intensive care, can be followed by death or discharge, so does not prevent observation of these events. Processes with intermediate events are instead described by multi-state models, which are the subject of the next post.
To correctly address competing risks, “competing risks survival models” are available. In these models an individual is observed over time, with several possible events ‘competing’ until one takes place and the individual transitions to the corresponding state. Importantly, these methods do not require an assumption of independence between the times to the competing events, and censoring can still be appropriately accounted for (provided it is independent of the event process).
Cause-specific survival functions
We’ll start by defining the cause-specific hazard and cause-specific cumulative incidence functions, which are the key components of competing risks survival analysis.
Cause-specific hazard function
Let \(T\) be a random variable for the survival time and \(C\) be a random variable for the cause of failure. The cause-specific hazard function for the \(j\)th cause, \(j = \{1, 2, \ldots, m\}\) is defined by:
\[ h_j(t) = \lim_{\delta t \downarrow 0} \frac{\Pr(t \leq T < t + \delta t, C=j \mid T \geq t)}{\delta t} \]
Defining \(f_j(t)\) as the cause-specific density function, and \(S(t)=\Pr(T \geq t)\) as the overall survivor function, the relationship shown in part II of this series still holds in the presence of competing risks:
\[ h_j(t)=\frac{f_j(t)}{S(t)} \]
Cause-specific cumulative incidence
The cause-specific cumulative incidence function, i.e. the probability of failure from cause \(j\) before time \(t\), in the presence of all other risks, is given by:
\[ F_j(t) = \Pr(T < t, C=j) \]
for \(j=\{1, 2, \dots, m\}\), with \(\Pr(C=j)\) often written as \(\pi_j\).
An expression for \(F_j(t)\) in terms of the cause-specific hazard function may be derived using the equation above:
\[ \begin{aligned} h_j(t) &=\frac{f_j(t)}{S(t)} \\ f_j(t) &=S(t)h_j(t) \\ F_j(t) &=\int_0^t S(u)h_j(u) du \end{aligned} \]
Aalen-Johansen estimator
The standard non-parametric estimator of the cause-specific incidence function is the Aalen-Johansen estimator, also described as the ‘multi-state version’ of the Kaplan-Meier estimator.
The Aalen-Johansen estimator is built from the non-parametric Nelson-Aalen estimator of the cause-specific hazard function for cause \(j\), which has increments:
\[ \hat{h}_j(t) = \frac{d_{j}(t)}{n(t\mbox{-})} \]
where \(d_{j}(t)\) is the number of events due to cause \(j\) at time \(t\), and \(n(t\mbox{-})\) is the number of individuals at risk just prior to \(t\).
With the Kaplan-Meier estimate of the survivor function defined in part III of this series, \(\hat{S}(t)\), the Aalen-Johansen estimator for the cause-specific cumulative incidence function then follows from the equation above:
\[ \hat{F}_j(t) = \sum_{t_k \leq t} \hat{S}(t_{k-1})\frac{d_{j}(t_k)}{n(t_k\mbox{-})} \]
for all times \(t_k \leq t\) where transition events are observed to occur.
The choice between cause-specific hazards and cumulative incidence depends on the research question. Cause-specific hazards are often preferred for aetiological questions about how a covariate affects the instantaneous rate of a given event. Cumulative incidence, and regression models such as Fine-Gray, are often preferred when the aim is to estimate or predict the absolute risk of a given event over time in the presence of competing risks.
R example
We can illustrate the difference between the naive Kaplan-Meier estimate and the Aalen-Johansen estimator for cumulative incidence in a simple example. Consider a dataset of 10 patients with follow-up times and event types (death, discharge, or censoring):
library(survival)

cr_data <- data.frame(
  time   = c( 2,    3,    4,      5,     6,
              7,    8,    9,     10,    11),
  status = c("death", "discharge", "censor", "death", "discharge",
             "death", "censor",    "discharge", "death", "censor")
)

# Naive estimate: treat discharge as ordinary censoring
km_fit <- survfit(Surv(time, status == "death") ~ 1, data = cr_data)

# Aalen-Johansen: with a multi-state outcome, survfit() returns the estimated
# probability of being in each state; the first level is censoring
aj_fit <- survfit(
  Surv(time, factor(status, levels = c("censor", "death", "discharge"))) ~ 1,
  data = cr_data
)

cif_df <- data.frame(
  time   = c(0, aj_fit$time),
  cif_aj = c(0, aj_fit$pstate[, "death"]),
  cif_km = c(0, 1 - summary(km_fit, times = aj_fit$time, extend = TRUE)$surv)
)

round(cif_df, 2)
time cif_aj cif_km
1 0 0.00 0.00
2 2 0.10 0.10
3 3 0.10 0.10
4 4 0.10 0.10
5 5 0.21 0.23
6 6 0.21 0.23
7 7 0.33 0.38
8 8 0.33 0.38
9 9 0.33 0.38
10 10 0.48 0.69
11 11 0.48 0.69ggplot(cif_df, aes(x = time)) +
geom_step(aes(y = cif_km, colour = "Naive (1 - KM)"), linewidth = 1.1) +
geom_step(aes(y = cif_aj, colour = "Aalen-Johansen"), linewidth = 1.1) +
scale_colour_manual(
values = c(
"Naive (1 - KM)" = blog_cols[["dark"]],
"Aalen-Johansen" = blog_cols[["red"]]
)
) +
scale_y_continuous(limits = c(0, NA), name = "Cumulative incidence of death") +
scale_x_continuous(name = "Follow-up time")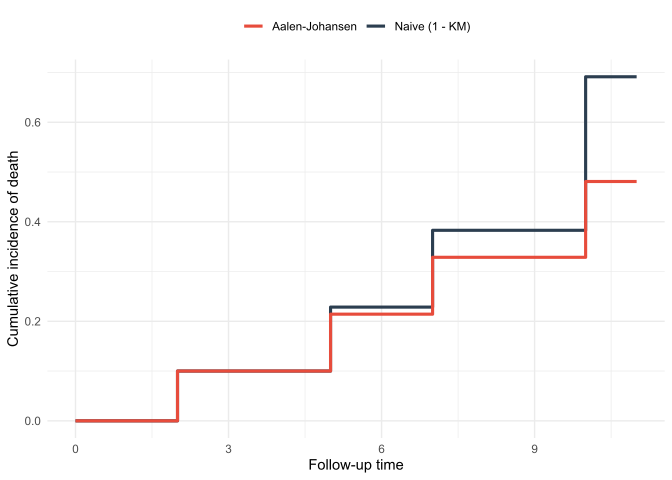
The Aalen-Johansen estimate is equivalent to the sum \(\hat{F}_j(t) = \sum_{t_k \leq t} \hat{S}(t_{k-1})\, d_{j}(t_k)/n(t_k\mbox{-})\) given above, where \(\hat{S}\) is the Kaplan-Meier estimate of surviving all causes.
The naive curve lies above the Aalen-Johansen estimate because discharge is handled as if it were non-informative censoring, even though it removes patients from ever experiencing the event of interest.
Fine-Gray proportional hazards model
Analogous to the Cox proportional hazards model described in the last post, the Fine-Gray proportional hazards model may be used to estimate the hazard of the event of interest (termed the sub-distribution hazard) among those yet to experience that event by time \(t\). The risk set for the sub-distribution hazard consists of both those who have yet to experience any event, and those who have already experienced a competing event (who remain in the risk set).
Sub-distribution hazard
The sub-distribution hazard is therefore defined as the instantaneous risk of experiencing the event of interest \(j\) given that the individual has not already experienced this event:
\[ \lambda_j(t)=\lim_{\delta t \downarrow 0}{\frac{\Pr\left(t \leq T < t + \delta t, C=j \mid T>t \text{ or} \left(T \le t, C \neq j\right)\right)}{\delta t}} \]
where, as before, \(C\) is the random variable for the event that occurs.
Fine-Gray regression model
Fine-Gray regression links the sub-distribution hazard, \(\lambda_{j}\), to the cause-specific cumulative incidence function, \(F_{j}\), through the relationship:
\[ \lambda_{j}(t) = - \frac{d}{dt} \log{(1-F_{j}(t))} \]
As with the Cox proportional hazards model, a proportional hazards regression model is assumed, where the hazard of cause \(j\) at time \(t\) for individual \(i\) is:
\[ \lambda_{i,j}(t) = \exp(\boldsymbol{\beta}^\mathsf{T}\boldsymbol{z}_i)\lambda^{(0)}_{j}(t) \]
with \(\lambda^{(0)}_{j}(t)\) being the baseline sub-distribution hazard for cause \(j\). Covariate coefficients are estimated by maximising the weighted partial likelihood \(L(\boldsymbol{\beta})\):
\[ L(\boldsymbol{\beta}) = \prod_{i \in \mathcal{E}}\frac{\exp(\boldsymbol{\beta}^\mathsf{T}\boldsymbol{z}_{d_i})}{\sum_{\ell \in R_i}w_{i,\ell}\exp(\boldsymbol{\beta}^\mathsf{T}\boldsymbol{z}_\ell)} \]
where \(w_{i,\ell}\) are inverse probability of censoring weights, which down-weight individuals who have experienced a competing event to account for the probability that they would have been censored had they remained under follow-up, \(\mathcal{E} = \{T_1, T_2, \ldots, T_n\}\) are the set of distinct failure times, \(R_i\) is the set of all individuals who are at risk of failure immediately before time \(T_i\) (including those who have experienced a competing event), \(\boldsymbol{z}_{d_i}\) is the covariate vector for an individual who failed at time \(T_i\), and \(\boldsymbol{z}_\ell\) is the covariate vector for the \(\ell\)th individual at risk at time \(T_i\). Covariate effects on the sub-distribution hazard may be interpreted as covariate effects on the cumulative incidence of the event of interest.
Stratification
Whilst proportional hazards models are a common method for incorporating covariates in survival analyses, a more straightforward approach is through stratification. In a stratified model the population is subdivided according to covariate group (or strata), the survival is compared within each stratum, and the differences within stratum are combined to give an overall comparison.
As stratification allows the baseline hazard to vary across strata it is sometimes used to accommodate non-proportional hazards in Cox and Fine-Gray proportional hazards. Since the effect of the stratifying variable itself is not estimated, stratification is most useful for variables which are not of direct interest.
NoteKey takeaways
- Competing risks occur when individuals can experience multiple possible events that prevent the observation of other events.
- Kaplan-Meier can overestimate the probability of an event of interest when competing risks are treated as ordinary censoring.
- Cause-specific Cox models remain useful for modelling cause-specific hazards, but do not directly estimate cumulative incidence.
- The cause-specific hazard function measures the instantaneous risk of a specific event type.
- The cause-specific cumulative incidence function gives the probability of experiencing a specific event type over time.
- The Aalen-Johansen estimator is the non-parametric method for estimating cumulative incidence in competing risks scenarios.
- The Fine-Gray model allows regression analysis for competing risks data by modelling the sub-distribution hazard.
- Stratification can accommodate non-proportional hazards in both Cox and Fine-Gray models.
Coming next
The competing risks models shown in this post are a special case of multi-state models. In the next post, I’ll provide some of the theory of multi-state models and their applications in epidemiology, including estimating transition intensities and future states.
References
- Aalen OO, Johansen S. An Empirical Transition Matrix for Non-Homogeneous Markov Chains Based on Censored Observations. Scand Stat Theory Appl. 1978;5(3):141-50.
- Borgan, Ø. Nelson-Aalen Estimator. Wiley StatsRef: Statistics Reference Online. 2014.
- Collett, D. Modelling Survival Data in Medical Research. Chapman & Hall/CRC Texts in Statistical Science. 2023.
- Fine JP, Gray RJ. A proportional hazards model for the subdistribution of a competing risk. J Am Stat Assoc. 1999;94(446):496-509.
- Hosmer DW, Lemeshow S. Applied survival analysis: Regression modeling of time to event data. Wiley. 1999.
Reuse
Citation
BibTeX citation:
@online{kirwan2025,
  author = {Kirwan, Peter},
  title = {Part {IV:} {Competing} Risks Survival Methods},
  date = {2025-08-19},
  url = {https://www.pkirwan.com/blog/competing-risks-methods/},
  langid = {en}
}
For attribution, please cite this work as:
Kirwan, Peter. 2025. “Part IV: Competing Risks Survival
Methods.” August 19. https://www.pkirwan.com/blog/competing-risks-methods/.